婦人科系疾患に特化したセルフケアアプリ
記録から、
からだの変化を
理解する。
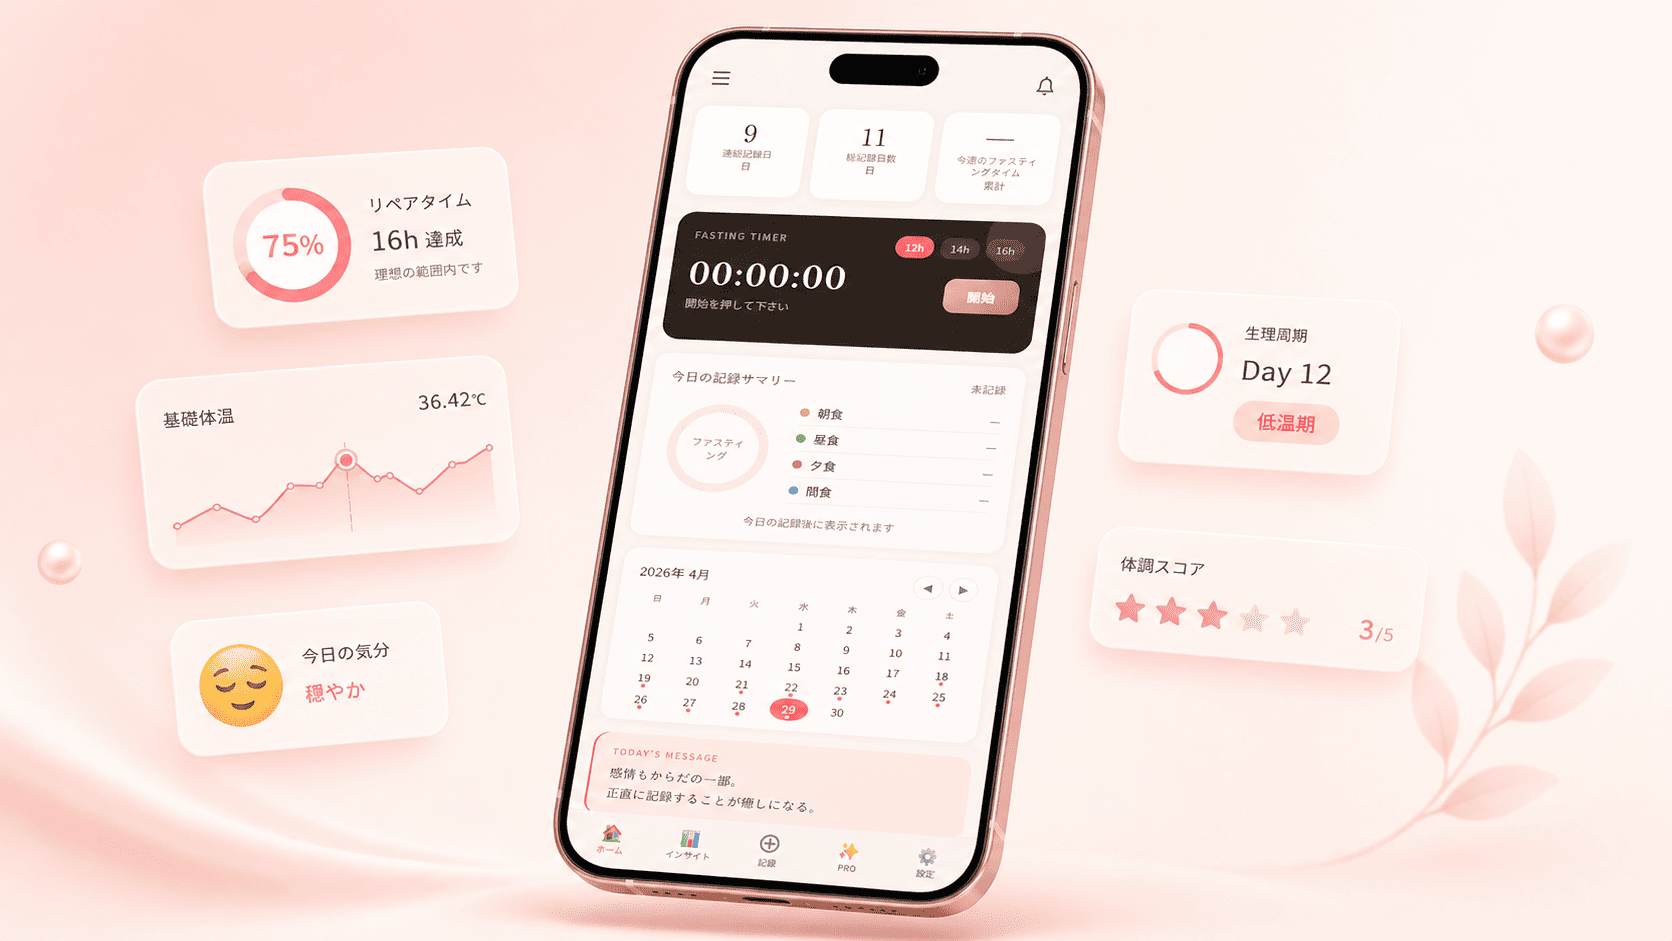
食事・体調・生活習慣をひとつにまとめ、
あなただけのコンディションパターンを可視化。
日本人女性の38%が36℃未満の低体温(AMED 31万人調査)。
基礎体温の記録だけで、排卵リズムや炎症の兆候が見えてきます。 あなたの体温パターン、把握できていますか?
基礎体温の記録だけで、排卵リズムや炎症の兆候が見えてきます。 あなたの体温パターン、把握できていますか?
記録をはじめる →
無料ではじめられます
広告なし・登録不要
特長
端末内保存のみ
広告なし
6カテゴリ対応
プライバシー最優先
Gynecological health tracking app
Track your body.
Understand your patterns.
Log food, symptoms, and daily habits in one place.
Built for women living with chronic gynecological conditions.
38% of Japanese women have body temperature below 36°C (AMED survey, 310,000 participants).
Basal body temperature logging reveals ovulation rhythms and early signs of inflammation. Do you know your temperature pattern?
Basal body temperature logging reveals ovulation rhythms and early signs of inflammation. Do you know your temperature pattern?
Start Tracking — Free →
No sign-up required
No ads · Data stays on your device
Features
Device-only storage
Ad-free
6 categories
Privacy-first
11
対応疾患
Conditions
無料
広告なし
Ad-free
100%
端末内保存
Private